How to Use an EHS Statistics Dashboard to Strengthen Your Safety Program
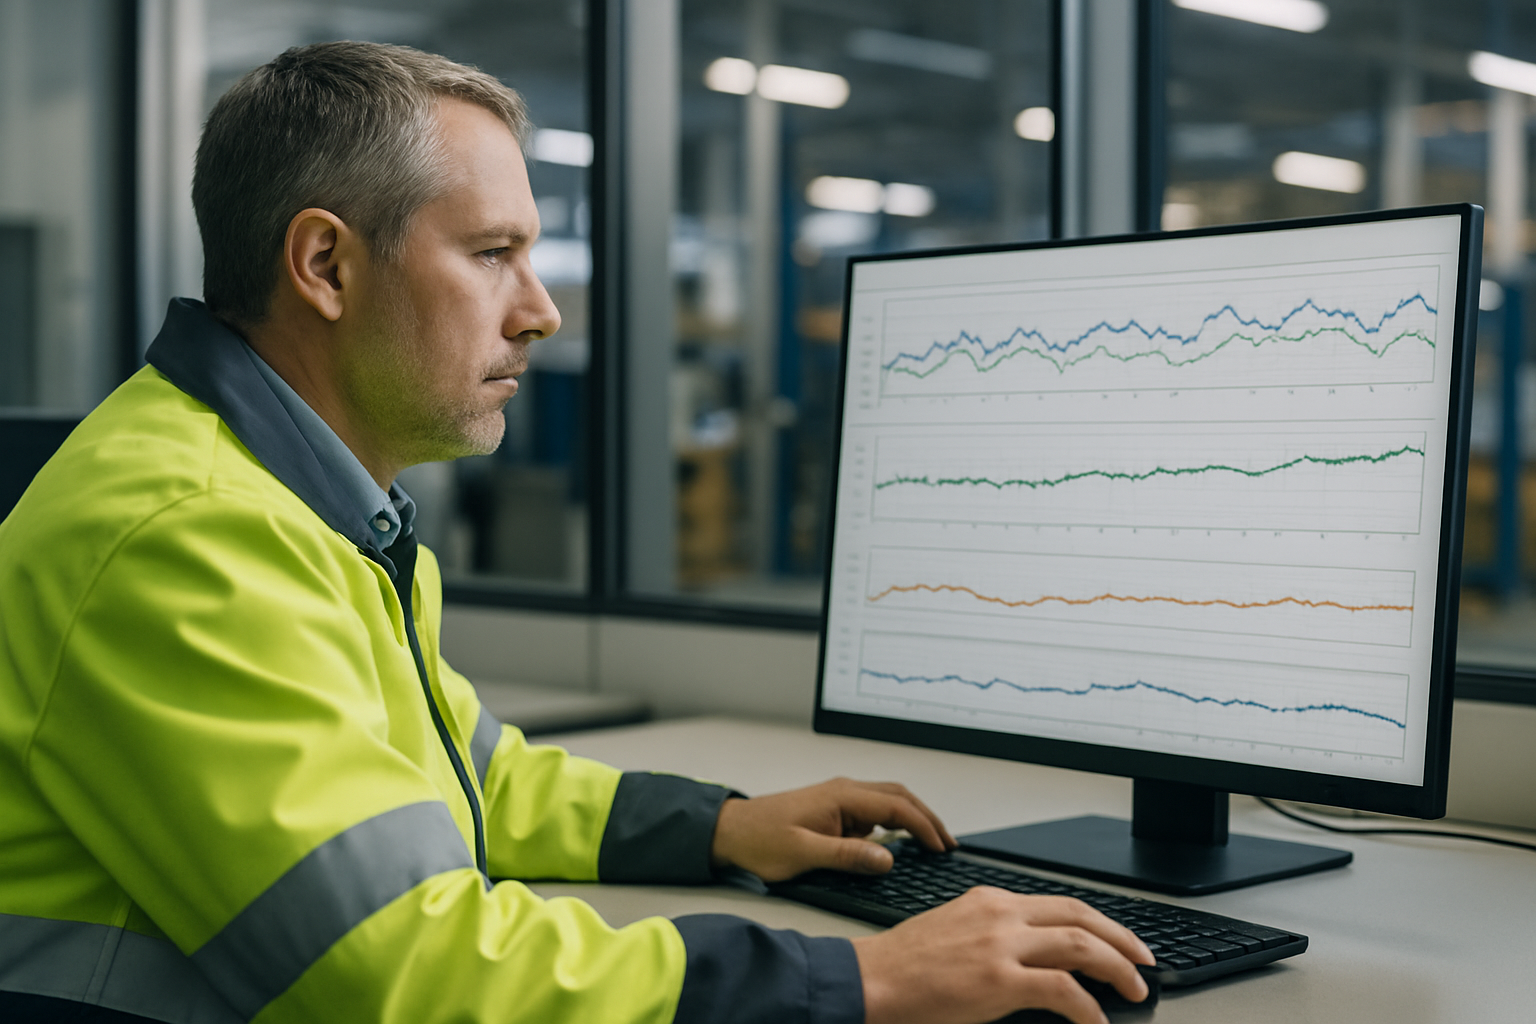
Learn how an EHS statistics dashboard helps safety managers benchmark trends, improve training, and turn data into clear action steps.
Published: June 29, 2026 · By SafetyNet Editorial Team
Category: Industrial Safety
Frequently Asked Questions
What is the main value of an EHS industry statistics dashboard?
It helps safety managers move beyond isolated incident counts and see patterns that support better decisions. The main value is using internal and industry trend data to guide training, committee work, and prevention priorities.
How should we compare our company to others in our industry?
Use the comparison as a starting point, not a final conclusion. Look for differences, review the incidents behind the trend, and then decide whether the issue reflects a broader industry exposure or a site-specific gap.
Can dashboard data improve safety training?
Yes. The article explains that trend data can help you choose training topics based on the incidents and exposures that are most relevant to your workforce.
How can a safety committee use dashboard information?
A safety committee can review key trends, compare them to industry patterns, assign follow-up actions, and track whether those actions are reducing the problem over time. This makes meetings more focused and action-oriented.
What should we do after identifying a trend in the dashboard?
Turn the finding into a specific action plan. That may include targeted training, inspections, task observations, corrective actions, or leadership review depending on what the data shows.